Geospatial Analysis of Thermal Anomalies Using NASA FIRMS
It’s incredible that anyone with internet access can now view actual satellite photos of the planet for free! Satellites capture millions of images of cities, forests, oceans, and more every day. Experts and inquisitive individuals like us can both see how locations are changing over time, all thanks to these photos.
Verifying the veracity of events depicted in news reports, films, or photographs is an interesting application of satellite imagery. This is a major component of OSINT (Open-Source Intelligence) which uses publicly available data to gather information.
Chronolocation is the process of determining whether an event actually occurred when people claim it did by comparing satellite images to a picture or video (basically the exact time when it happened).

How I Found a Burning Oil Depot in Ukraine Using NASA FIRMS
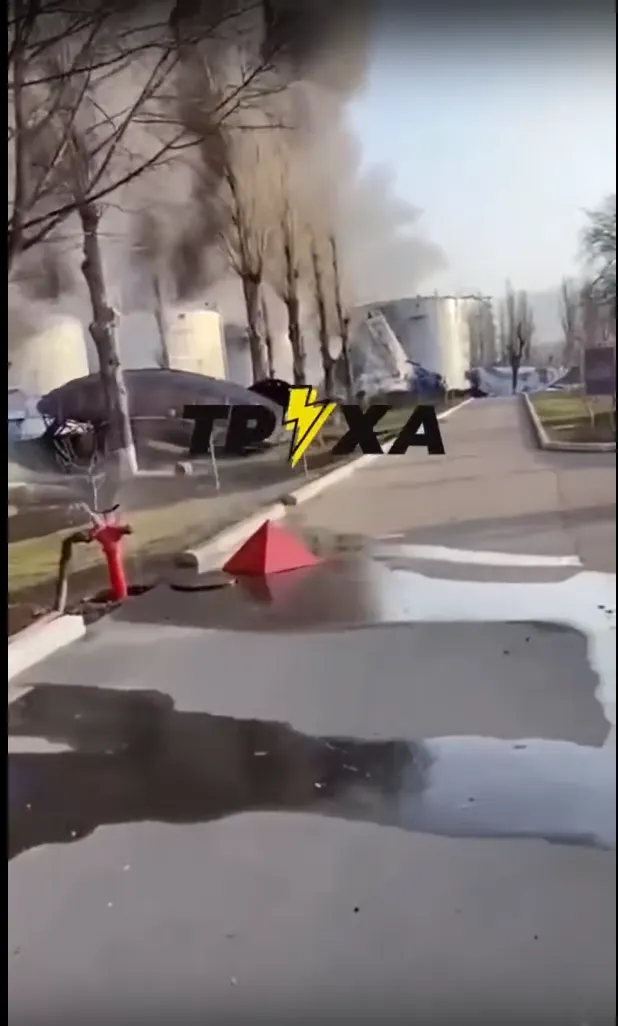
A few days ago, I saw a video on Twitter showing huge flames and smoke rising from a fuel depot in Kremenchuk, Ukraine. The tweet said, “Fuel depot on fire today after Russian strike.” but it wasn’t so easy to find the exact location.
There were too many industrial areas and silos for me to be able to guess which one was burning.
That’s when I thought of NASA FIRMS, a free website that uses satellite data to display fire locations in the past and present.
Let me walk you through exactly how I used FIRMS to solve the puzzle and you can do it too.
Step 1: Go to the FIRMS Website
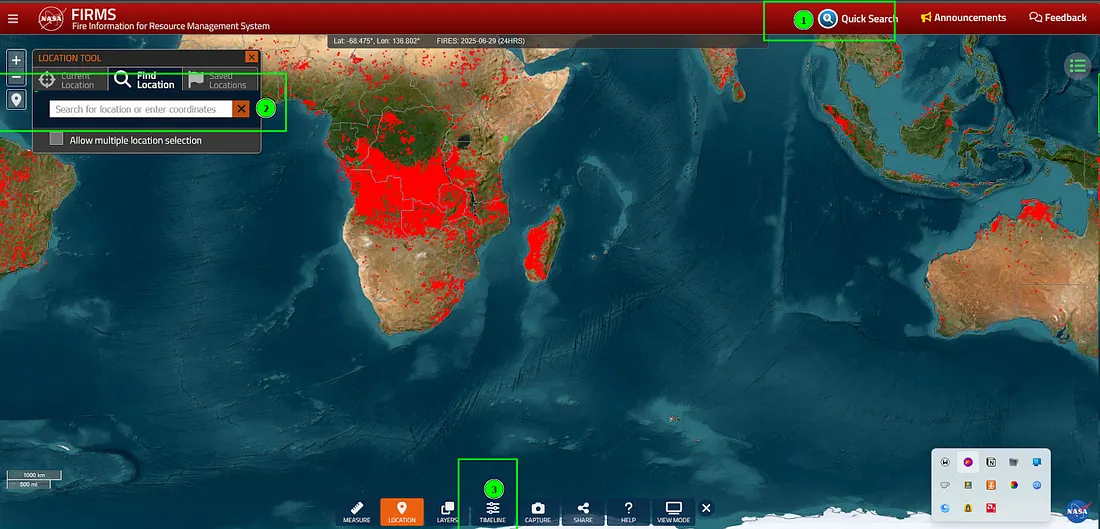
You’ll land on a world map that shows fire activity across the globe.
- Open your browser and search for “NASA FIRMS” or go directly to https://firms.modaps.eosdis.nasa.gov/map/
Step 2: Search the Location
The map will zoom roughly to the area around Kremenchuk, Ukraine. You might have to zoom in further yourself to see details.
- On the top right side of the map, find the “quick search(1)” box.On the left side of the map, find the “Location Search(2)” box.
- Type target city name/location and select it from the dropdown. For example, I am typing Kremenchuk.
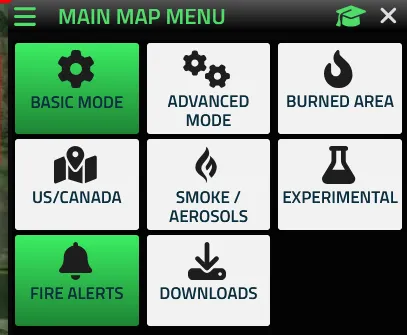
Step 3: Turn on the Fire Data
Now change the Basic mode to Advanced mode.
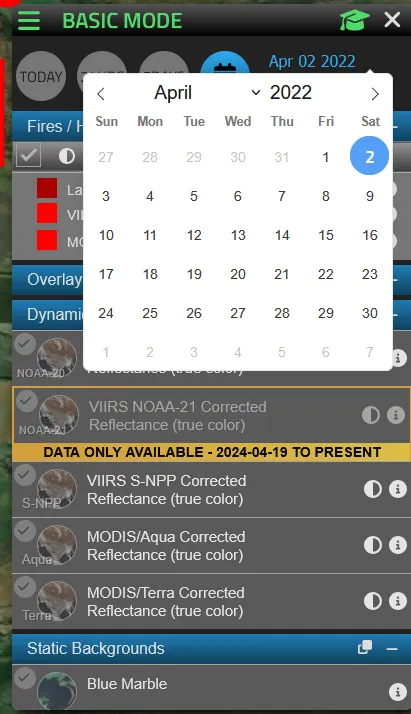
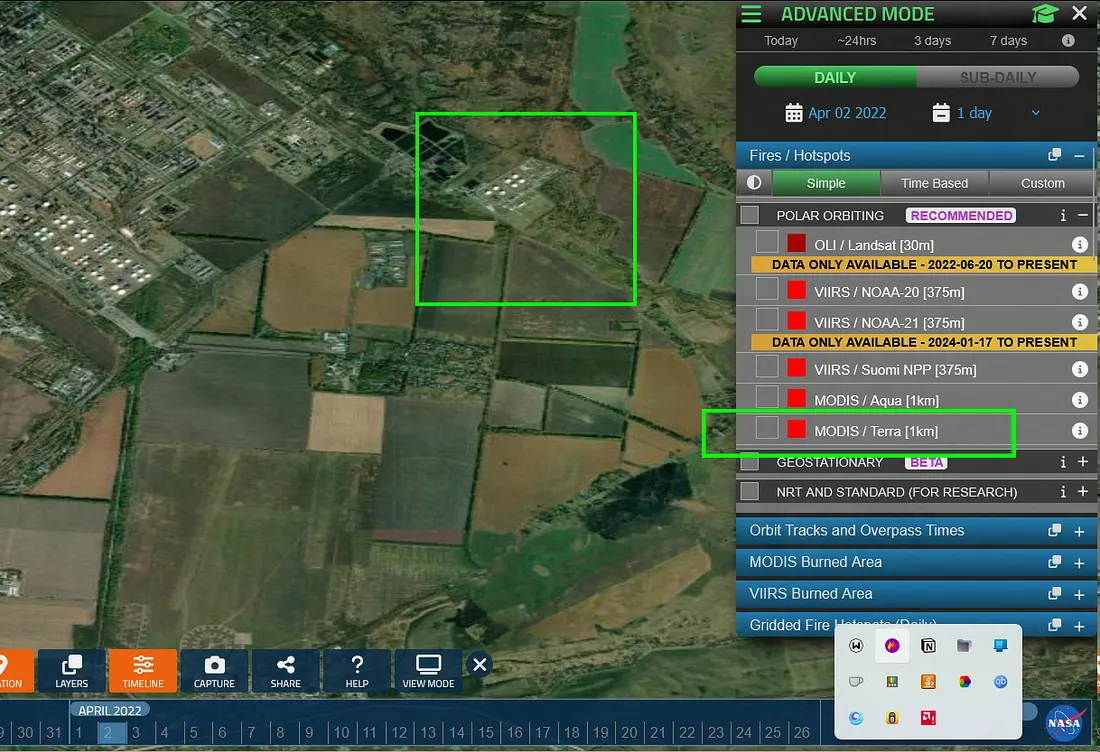
Enter the date you’re interested in. In my case, the fire happened on April 2, 2022, so I selected that date.
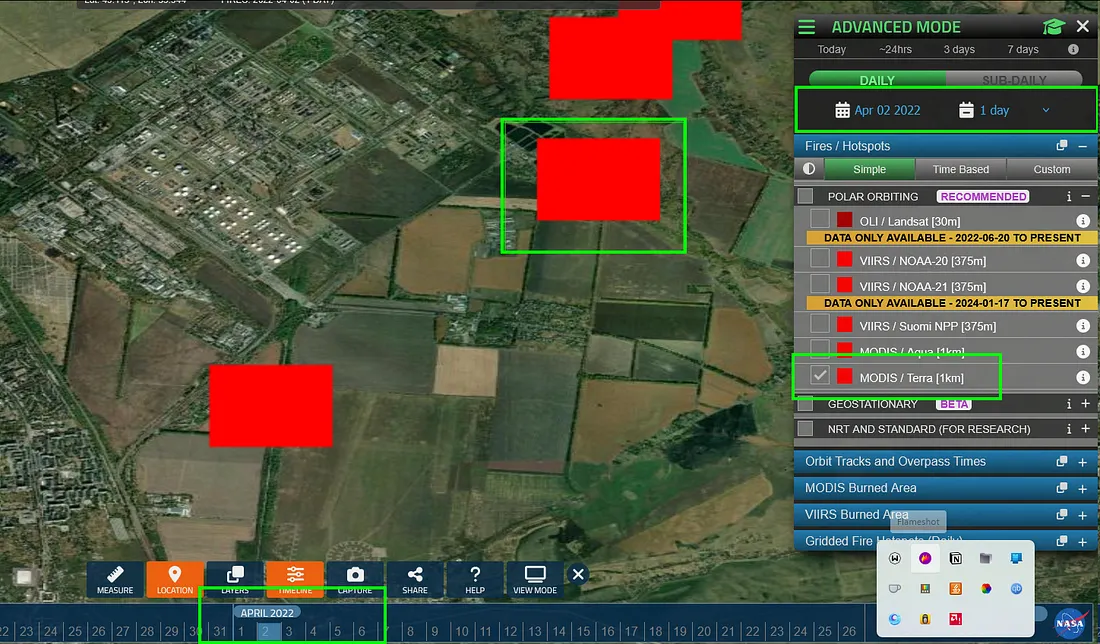
Suddenly, red or orange dots appear. These show where satellites detected heat or fire on that day.
Step 4: Understand What You’re Seeing
Each dot represents a fire or hotspot. FIRMS uses different satellites like Terra, Aqua, and VIIRS to detect heat from space. You don’t need to worry about the technical terms, just know those dots help you find where the fire happened.
Technical Explanation (Optional Reading)
In Advanced Mode, FIRMS provides four satellite data sources by default:
- VIIRS (Visible Infrared Imaging Radiometer Suite) from Suomi NPP and NOAA-20 satellites
- MODIS (Moderate Resolution Imaging Spectroradiometer) onboard Terra and Aqua satellites
These sensors detect active fires and thermal anomalies by capturing visible and infrared imagery at varying resolutions.
For the Kremenchuk fire on April 2, 2022, the thermal data was sourced from the MODIS sensor on Terra, confirming fire activity in the area.
Understanding the Limits — Heat Markers Aren’t Always Fire
Here’s where it gets interesting — sometimes these “heat spots” can show up even when there’s no real fire. Here’s why:
Smoke Reflection or Intense Sunlight: Thick smoke can reflect heat signatures. In some cases, even bright sunlight hitting reflective surfaces (like metal rooftops) could confuse the sensors.
Atmospheric Conditions: Dust, haze, or cloud patterns sometimes interfere, creating false positives or misplacing the heat location slightly
Wind Effects: Wind can shift smoke, embers, or even the flames themselves. As a result, the heat marker on the map might appear slightly away from the actual ground location of the fire.
Fire Intensity Matters: Small campfires or weak heat sources might go undetected. But large, intense fires (like industrial fires or wildfires) produce strong heat signatures, making them easier for satellites to spot.
During my investigation, I found that the heat spot detected on April 2, 2022, near Kremenchuk aligned with the reported location of the fire, indicating that the event was likely authentic.
Stay connected with OSINT JOURNO! In our upcoming blogs, we’ll guide you step-by-step on how to conduct your own OSINT and GEOINT investigations using advanced satellite tools, Sentinel Maps, and more. Follow OSINT JOURNO for expert insights and hands-on techniques.
Author
Abrar Jahin Sachcha